1. Business Activities, Material Balance, and Environmental Accounting
We aim to continuously reduce our environmental impact and promote environmental management by measuring resources and energy input in our business activities and understanding our environmental impact.
INPUT - Main Resources and Energy Inputs
| < Domestic non-consolidated > | |||||
| unit | FY2022 | FY2023 | FY2024 | ||
|---|---|---|---|---|---|
| Office | electricity | MWh | 2,632 | 3,446 | 3,373 |
| Construction sites | electricity | MWh | 18,810 | 20,328 | 21,483 |
| kerosene | kL | 350 | 194 | 276 | |
| diesel | kL | 20,244 | 14,285 | 11,663 | |
| fuel oil | kL | 0 | 317 | 0 | |
| < Domestic non-consolidated > | ||||
| unit | FY2022 | FY2023 | FY2024 | |
|---|---|---|---|---|
| Ready-mixed concrete | thousand tonnes | 1,127.0 | 1,253.0 | 974.1 |
| Rebar | thousand tonnes | 70.0 | 88.7 | 60.4 |
| Steel frame | thousand tonnes | 26.5 | 45.1 | 33.3 |
| Cement | thousand tonnes | 27.2 | 22.6 | 23.5 |
| < Domestic non-consolidated > | ||||
| unit | FY2022 | FY2023 | FY2024 | |
|---|---|---|---|---|
| Blast furnace ready-mixed concrete | thousand tonnes | 200.4 | 104.7 | 159.1 |
| Electric arc furnace rebar | thousand tonnes | 70.0 | 88.7 | 60.4 |
| Electric arc furnace steel | thousand tonnes | 17.0 | 12.4 | 8.7 |
| Blast furnace cement | thousand tonnes | 2.4 | 3.1 | 0.0 |
| Recycled crushed stone | thousand tonnes | 72.8 | 59.9 | 83.1 |
| Asphalt mixture | thousand tonnes | 9.3 | 10.5 | 17.5 |
| Soil generated from construction | thousand m³ | 550.9 | 162.5 | 270.7 |
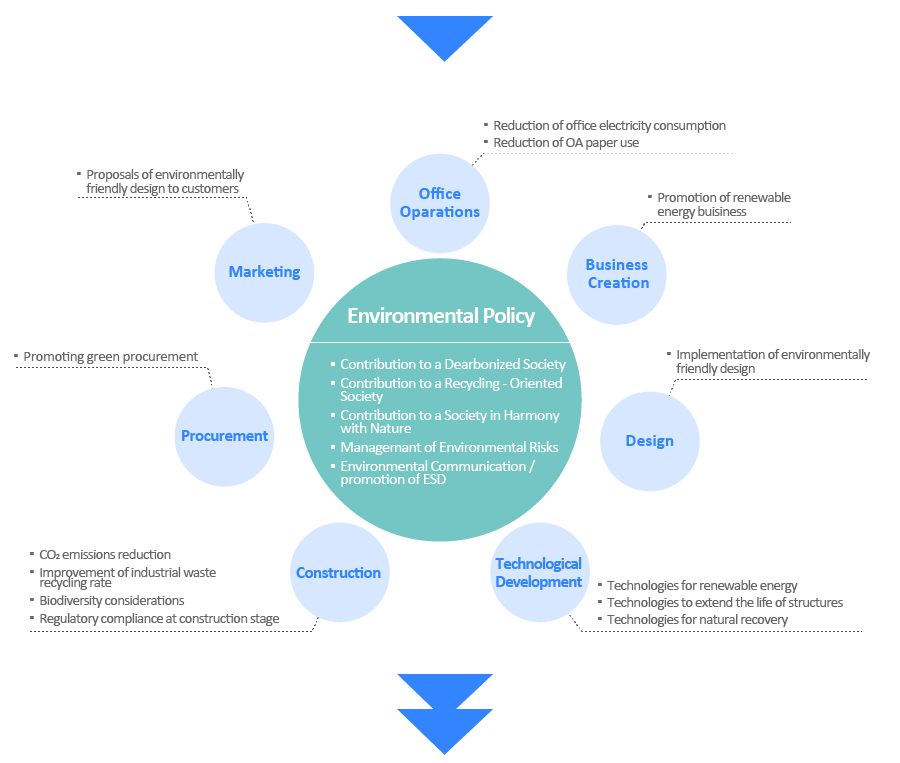
Activities of Each Sector
OUTPUT - Main Emissions
| < Domestic non-consolidated > | |||||
| Scope 1 and Scope 2 | unit | FY2022 | FY2023 | FY2024 | |
|---|---|---|---|---|---|
| CO2 Emissions | thousand t-CO2 | 62.6 | 45.3 | 35.2 | |
| Office activities | thousand t-CO2 | 2.0 | 1.0 | 1.7 | |
| Construction stage | thousand t-CO2 | 60.6 | 44.3 | 33.5 | |
| Emission Intensity | t-CO2/100 million yen | 21.9 | 15.5 | 12.6 | |
| Scope 3 | unit | FY2022 | FY2023 | FY2024 | |
|---|---|---|---|---|---|
| CO2 Emissions | thousand t-CO2 | 1,335.5 | 1,358.6 | 1,116.0 | |
| Category 1 | thousand t-CO2 | 283.3 | 538.2 | 345.9 | |
| Category 11 | thousand t-CO2 | 954.1 | 736.4 | 727.0 | |
| Other categories | thousand t-CO2 | 98.1 | 84.0 | 43.1 | |
| < Domestic non-consolidated > | ||||||
| unit | FY2022 | FY2023 | FY2024 | |||
|---|---|---|---|---|---|---|
| Disposal of soil generated from construction | thousand m³ | 1085.0 | 1342.4 | 1,184.3 | ||
| Use of recycled resources | thousand m³ | 765.8 | 1021.6 | 794.9 | ||
| On-site | thousand m³ | 518.3 | 814.8 | 561.2 | ||
| Off-site delivery | thousand m³ | 247.5 | 206.8 | 233.7 | ||
| Other Processes | thousand m³ | 319.2 | 320.8 | 389.4 | ||
| < Domestic non-consolidated > | |||||
| unit | FY2022 | FY2023 | FY2024 | ||
|---|---|---|---|---|---|
| Disposal of construction waste | thousand tonnes | 551.3 | 452.4 | 222.9 | |
| Intermediate treatment | thousand tonnes | 520.6 | 430.7 | 209.5 | |
| Final disposal | thousand tonnes | 30.7 | 21.7 | 13.4 | |
| Disposal Intensity | t/100 million yen | 192.4 | 154.3 | 79.5 | |
Environmental Accounting
We calculate environmental conservation cost in order to clarify the costs and benefits for environmental conservation in our business activities.
| < Domestic non-consolidated > | ||||
| unit | FY2022 | FY2023 | FY2024 | |
|---|---|---|---|---|
| Environmental Conservation Cost | million yen | 5,389 | 5,832 | 5,335 |
| A) Cost within our business area | million yen | 4,392 | 4,681 | 4,403 |
| (Pollution prevention cost) | million yen | 1,513 | 1,366 | 1,607 |
| (Global environmental conservation cost) | million yen | 30 | 69 | 72 |
| (Resource circulation cost) | million yen | 2,849 | 3,246 | 2,724 |
| B) Upstream, downstream cost | million yen | 380 | 295 | 229 |
| C) Administrative activity cost | million yen | 409 | 638 | 466 |
| D) R&D cost | million yen | 175 | 181 | 190 |
| E) Social activity cost | million yen | 3 | 5 | 17 |
| F) Environmental remediation cost | million yen | 30 | 32 | 30 |
-
Calculation method of environmental accounting;
-
- The period covered : 1 April 2024 to 31 March 2025
- Boundary: Domestic head office, branch offices, three PC factories, and building construction sites and civil engineering work sites.
2. Contribution for Decarbonized Society
In November 2021, we set forth the "Roadmap to Carbon Neutrality by 2050" and are working to achieve a 50% reduction (from fiscal 2020) of CO2 emissions for Scope 1 + Scope 2 by 2030.
- * The boundary of calculation on a non-consolidated basis includes domestic construction sites, offices and factories, and overseas construction sites and offices of Sumitomo Mitsui Construction Co., Ltd.
Overseas CO2 emissions in fiscal 2020 are calculated based on the ratio of domestic and overseas net sales of completed construction contracts. The figures in fiscal 2022 are based on a 2-month survey of the types of heavy construction equipment, the number of units in operation, and the operating hours, and estimated using the percentage of net sales of completed construction contracts. The boundary of calculation on a consolidated basis includes the construction sites, offices, and factories of domestic affiliates, and the construction sites and offices of overseas subsidiaries. In fiscal 2023, the figures are estimated on the ratio of net sales of completed construction contracts based on a 5-month (Sumitomo Mitsui Construction Co., Ltd.) and 2-month (overseas subsidiaries) survey of fuel used in heavy construction equipment and electricity used for construction equipment. In fiscal 2024, the amount of fuel used for construction heavy machinery and the amount of electricity used for construction machinery were calculated based on a 12-month survey.
The boundary of calculation on a consolidated basis includes construction sites, offices and factories of domestic consolidated subsidiaries and construction sites and offices of overseas subsidiaries. - * Emission factors used in the calculation of CO2 emissions (Scope 1 and Scope 2) in fiscal 2020 and 2022 are those provided by Keidanren (Japan Business Federation) for kerosene, diesel oil, and heavy oil A, and the default values under the Act on Promotion of Global Warming Countermeasures for the others in fiscal 2020 and 2022. Emission factors used in the calculation of CO2 emissions (Scope 1 and Scope 2) in fiscal 2023 and 2024 are the default values under the Act on Promotion of Global Warming Countermeasures. The emission factors for each fuel overseas in fiscal 2024 are the values of IPCC (outside the U.S.) and EPA (U.S.).
Emission factors for domestic electricity in fiscal 2020 are provided by Keidanren (Japan Business Federation), and those from fiscal 2022 are based on each contract. Emission factors for overseas electricity are the country-specific emission factors described in "Emissions intensity database for calculation of greenhouse gas emissions of organizations through supply chains" (from fiscal 2020 to 2023), "IEA Emissions Factors 2024" (in fiscal 2024), and the default values under the Act on Promotion of Global Warming Countermeasures for the others. - * The amount of diesel oil used in heavy construction equipment at construction sites is calculated based on the total number of heavy construction equipment in operation for each type of equipment, in accordance with the "Environmental Information Disclosure Guidelines" of the Japan Federation of Construction Contractors (Nikkenren), using JFCC's survey sheet.
- * Scope 1, 2, and Scope 3 Category 1 excluded overseas construction sites with less than 100 million yen and construction periods of less than 6 months. Scope 3 Category 11 included domestic construction sites for which energy-saving calculations were performed and excluded overseas construction sites completed in the reporting year with less than 100 million yen and construction periods of less than 6 months.
| < Non-consolidated > | |||||
| unit |
FY2020 | FY2022 | FY2023 | FY2024 | |
|---|---|---|---|---|---|
| Total Emissions | t-CO2 | 70,766 | 112,113 | 63,437 | 45,289 |
| Scope 1 (domestic) | t-CO2 | 50,328 | 54,844 | 39,734 | 32,017 |
| Scope 1 (overseas) | t-CO2 | 6,251 | 45,732 | 15,595 | 6,291 |
| Scope 2 (domestic) | t-CO2 | 12,491 | 7,855 | 5,633 | 3,269 |
| Scope 2 (overseas) | t-CO2 | 1,696 | 3,682 | 2,475 | 3,712 |
| Intensity | t-CO2/100million yen | 22.0 | 33.2 | 18.8 | 14.2 |
| % of base year | % | 0.0 | 58.4 | -10.4 | -36.0% |
| < Consolidated > | |||||||
| unit | FY2020 | FY2022 | FY2023 | FY2024 | |||
|---|---|---|---|---|---|---|---|
| SMC Group | t-CO2 | 120,719 | 169,077 | 130,740 | 105,290 | ||
| Scope 1 | t-CO2 | 99,667 | 147,973 | 114,925 | 93,491★ | ||
| Scope 2 | t-CO2 | 21,052 | 21,104 | 15,815 | 11,799★ | ||
| SMC (Non-consolidated) | t-CO2 | 70,766 | 112,113 | 63,437 | 45,289 | ||
| Scope 1 (domestic) | t-CO2 | 50,328 | 54,844 | 39,734 | 32,017 | ||
| Scope 1 (overseas) | t-CO2 | 6,251 | 45,732 | 15,595 | 6,291 | ||
| Scope 2 (domestic) | t-CO2 | 12,491 | 7,855 | 5,633 | 3,269 | ||
| Scope 2 (overseas) | t-CO2 | 1,696 | 3,682 | 2,475 | 3,712 | ||
| Consolidated subsidiaries | t-CO2 | 49,953 | 56,964 | 67,303 | 60,001 | ||
| Scope 1 (domestic) | t-CO2 | 43,088 | 42,311 | 41,364 | 37,337 | ||
| Scope 1 (overseas) | t-CO2 | - | 5,086 | 18,233 | 17,846 | ||
| Scope 2 (domestic) | t-CO2 | 6,865 | 8,413 | 6,406 | 2,940 | ||
| Scope 2 (overseas) | t-CO2 | - | 1,154 | 1,301 | 1,878 | ||
- * Third-party assurance for consolidated Scope 1 and Scope 2 CO2 Emissions has been received since FY2023.
Values assured by the third -party are indicated with an asterisk (★).
| < Non-consolidated > | |||||
| unit | FY2020 (base year) | FY2022 | FY2023 | FY2024 | |
|---|---|---|---|---|---|
| Total Emissions | t-CO2 | 1,472,596 | 1,335,506 | 1,358,625 | 1,468,867 |
| Category 1 Purchased goods and services | t-CO2 | 242,619 | 283,290 | 538,236 | 382,893★ |
| Category 2 Capital goods | t-CO2 | 333 | 5,545 | 665 | 892 |
| Category 3 Fuel- and energy-related activities | t-CO2 | 9,014 | 15,542 | 9,763 | 6,337 |
| Category 4 Upstream transportation and distribution | t-CO2 | 1,417 | 9,594 | 12,595 | 7,307 |
| Category 5 Waste generated in operations | t-CO2 | 36,722 | 44,282 | 40,148 | 20,210 |
| Category 6 Business travel | t-CO2 | 1,225 | 2,239 | 3,454 | 3,101 |
| Category 7 Employee commuting | t-CO2 | 247 | 267 | 616 | 546 |
| Category 8 Upstream leased assets | t-CO2 | Not applicable | Not applicable | Not applicable | Not applicable |
| Category 9 Downstream transportation and distribution | t-CO2 | Not applicable | Not applicable | Not applicable | Not applicable |
| Category 10 Processing of sold products | t-CO2 | Not applicable | Not applicable | Not applicable | Not applicable |
| Category 11 Use of sold products | t-CO2 | 1,147,446 | 954,105 | 736,380 | 1,037,264★ |
| Category 12 End-of-life treatment of sold products | t-CO2 | 11,911 | 20,642 | 16,768 | 10,317 |
| Category 13 Downstream leased assets | t-CO2 | Not applicable | Not applicable | Not applicable | Not applicable |
| Category 14 Franchises | t-CO2 | Not applicable | Not applicable | Not applicable | Not applicable |
| Category 15 Investments | t-CO2 | 21,662 | 0 | 0 | 0 |
- *Non-consolidated Scope 3 Category 1 and Category 11 CO2 emissions for FY2024 have been independently assured. The values assured by an independent assurer are indicated with ★.
- *Materials to be calculated for Category 1 are concrete, rebar, PC steel, steel, cement, crushed stone, asphalt, and soil.
- *Since FY2023, CO2 emissions from fuel used for transporting waste and construction waste have been changed from Scope 1 to Scope 3 Category 4 (2,365t-CO2) and Scope 3 Category 5 (1,050t-CO2).
| < Consolidated > | |||||
| unit | FY2020 | FY2022 | FY2023 | FY2024 | |
|---|---|---|---|---|---|
| Total Emissions | t-CO2 | 1,631,788 | 1,788,777 | 2,680,310 | 3,685,639 |
| Category 1 Purchased goods and services | t-CO2 | 361,092 | 390,962 | 1,239,530 | 663,859 |
| Category 2 Capital goods | t-CO2 | 763 | 11,998 | 9,257 | 4,941 |
| Category 3 Fuel- and energy-related activities | t-CO2 | 18,558 | 27,406 | 20,490 | 15,834 |
| Category 4 Upstream transportation and distribution | t-CO2 | 18,970 | 15,495 | 21,681 | 277,642 |
| Category 5 Waste generated in operations | t-CO2 | 41,244 | 50,194 | 43,554 | 24,557 |
| Category 6 Business travel | t-CO2 | 3,163 | 4,540 | 6,520 | 5,737 |
| Category 7 Employee commuting | t-CO2 | 593 | 1,257 | 2,053 | 1,489 |
| Category 8 Upstream leased assets | t-CO2 | Not applicable | Not applicable | Not applicable | Not applicable |
| Category 9 Downstream transportation and distribution | t-CO2 | 1,242 | 1,585 | 1,310 | 1,064 |
| Category 10 Processing of sold products | t-CO2 | Not applicable | Not applicable | Not applicable | Not applicable |
| Category 11 Use of sold products | t-CO2 | 1,174,252 | 1,262,858 | 1,312,103 | 2,672,054 |
| Category 12 End-of-life treatment of sold products | t-CO2 | 11,911 | 22,482 | 23,813 | 18,462 |
| Category 13 Downstream leased assets | t-CO2 | Not applicable | Not applicable | Not applicable | Not applicable |
| Category 14 Franchises | t-CO2 | Not applicable | Not applicable | Not applicable | Not applicable |
| Category 15 Investments | t-CO2 | 0 | 0 | 0 | 0 |
- * Category 15 (Consolidated) for the base year is 0 because it is included in Scope 1 and Scope 2 of the consolidated subsidiaries.
| category | Caculation method |
|---|---|
| 1 | Calculated by multiplying the quantity of each material procured in the reporting year by the CO2 emission intensity of each material. CO2 emission intensity for concrete, rebar, PC steel, steel, cement, and crushed stone is based on the Ministry of the Environment "Emission intensity database for calculation of greenhouse gas emissions by organizations through supply chains (Ver. 3.5) (March 2025)". CO2 emission intensity for asphalt and soil is based on the CO2 emission intensity of IDEA(v2.3, December 27, 2019). |
| 2 | Calculated by multiplying the change in property, plant and equipment (Buildings, structures, machinery and equipment, vehicle carriers, tools, appliances and fixtures) from the previous year by the CO2 emission intensity of capital goods. CO2 emission intensity is based on "Emissions intensity database for calculation of greenhouse gas emissions of organizations through supply chains (Ver. 3.5) (March 2025)." |
| 3 | Calculated by multiplying electricity consumption in the reporting year (excluding electricity from renewable sources) by the CO2 emission intensity of electricity during fuel procurement. CO2 emission intensity is based on "Emissions intensity database for calculation of greenhouse gas emissions of organizations through supply chains (Ver. 3.5) (March 2025). For diesel oil, kerosene, A-type heavy oil, gasoline, LNG, LPG, and GTL, CO2 emission intensity is based on IDEA(v2.3, December 27, 2019). |
| 4 | Calculated using the Ton-Kilometer method or the fuel consumption method, based on the weight of materials procured in the reporting year and the average distance transported. CO2 emission intensity are based on "Emissions intensity database for calculation of greenhouse gas emissions of organizations through supply chains (Ver. 3.5) (March 2025)." |
| 5 | Calculated by multiplying the weight of construction waste disposal in the reporting year by the CO2 emission intensity (including transportation) for each type of waste. CO2 emission intensity is based on the "Emissions intensity database for calculation of greenhouse gas emissions of organizations through supply chains (Ver. 3.5) (March 2025)." |
| 6 | Calculated by multiplying the amount by means of transportation used for business trips (Railways, aircraft, buses and taxis) by the CO2 emission intensity by means of transportation. CO2 emission intensity is based on "Emissions intensity database for calculation of greenhouse gas emissions of organizations through supply chains (Ver. 3.5) (March 2025)." |
| 7 | Calculated by multiplying the amount of commuting expenses by means of transportation (Railways, buses and private cars) by the CO2 emission intensity by means of transportation. CO2 emission intensity is based on "Emissions intensity database for calculation of greenhouse gas emissions of organizations through supply chains (Ver. 3.5) (March 2025)." |
| 9 | Calculated using the Ton-Kilometer method or the fuel consumption method, based on the weight of materials sold in the reporting year and the average distance transported. CO2 emission intensity are based on "Emissions intensity database for calculation of greenhouse gas emissions of organizations through supply chains (Ver. 3.5) (March 2025)." |
| 11 | For domestic buildings completed in the reporting year, annual CO2 emissions are calculated based on BEI values, standard primary energy consumption, and primary energy composition ratio in the energy conservation statement, and then multiplied by the duration of use of the building. For overseas buildings completed in the reporting year, annual CO2 emissions are calculated by multiplying the total floor area by the emission intensity per unit area for each building use, and then multiplied by the duration of use of the building. CO2 emission intensity per unit area for each use of the building is based on "Emissions intensity database for calculation of greenhouse gas emissions of organizations through supply chains (Ver. 3.5) (March 2025)." |
| 12 | The amount of CO2 emitted when disposing of materials for projects completed in the reporting year was calculated from the amount of CO2 emitted when dismantling the projects. The amount of CO2 emitted when disposing of materials was calculated by dividing the quantity of materials such as concrete, reinforcing steel, PC steel, steel, cement, crushed stone, and asphalt by the ratio of sales of projects completed in the reporting year to sales in the reporting year, and multiplying the ratio by the CO2 emission intensity. The CO2 emission intensity was based on the "Emissions intensity database for calculation of greenhouse gas emissions of organizations through supply chains (Ver. 3.5) (March 2025)". The amount of CO2 emitted when dismantling projects completed in the reporting year was estimated from the total floor area of projects completed in the reporting year by calculating the amount of CO2 emitted per unit area based on the results of demolition projects of Sumitomo Mitsui Construction Co., Ltd. |
| 15 | Calculated by multiplying the amount of investment made in the reporting year and the CO2 emission intensity of the investment. CO2 emission intensity of the investment is based on "Emissions intensity database for calculation of greenhouse gas emissions of organizations through supply chains (Ver. 3.5) (March 2025)." |
- *GHG emissions quantification is subject to uncertainty when measuring activity data, determining emission factors, and considering scientific uncertainty inherent in the Global Warming Potentials.
3. Contribution to Recycling-Oriented Society
To achieve zero emissions at our construction sites, we have set a KPI of 100% recycling(*1) of construction waste by FY2030. To achieve this target, we are implementing thorough waste separation and outsourcing proper disposal.
We also aim to create a recycling-oriented society that enables sustainable development by prioritizing the procurement of materials, equipment and office supplies with less environmental impact (green procurement) and adopting construction methods and technologies with less environmental impact.
下記のエリアは、左右にスワイプして横スクロールができます。
| <Domestic non-consolidated > | ||||||||||
|
| FY2022 | FY2023 | FY2024 | FY2030 | ||||||
|---|---|---|---|---|---|---|---|---|---|---|
| Target | Performance | Achievement | Target | Performance | Achievement | Target | Performance | Achievement | Long-Term Goal | |
| Civil Engineering Construction | 99.2 | 99.3 | ◯ | 99.3 | 99.3 | ◯ | 99.4 | 99.1 | ✕ | 100.0 |
| Building Construction | 98.9 | 97.8 | ✕ | 99.0 | 98.7 | ✕ | 99.2 | 97.1 | ✕ | 100.0 |
- (*1)The recycling rate excludes hazardous wastes and other wastes that cannot be treated with intermediate processing.
| < Domestic non-consolidated > | ||||
| unit | FY2022 | FY2023 | FY2024 | |
|---|---|---|---|---|
| Disposal | thousand tonnes | 551.3 | 452.4 | 222.9 |
| Landfill | thousand tonnes | 30.7 | 21.7 | 13.4 |
| (%) of final disposal | % | 5.6 | 4.8 | 6.0 |
| < Domestic non-consolidated > | |||||
| unit | FY2022 | FY2023 | FY2024 | ||
|---|---|---|---|---|---|
| Total | thousand tonnes | 551.3 | 452.4 | 222.9 | |
| Concrete mass | thousand tonnes | 240.4 | 222.5 | 104.9 | |
| Asphalt and concrete mass | thousand tonnes | 45.9 | 36.9 | 26.8 | |
| Waste timber | thousand tonnes | 14.6 | 13.8 | 7.7 | |
| Construction Sludge | thousand tonnes | 170.5 | 117.0 | 36.0 | |
| Plastic waste | thousand tonnes | 1.6 | 5.0 | 5.6 | |
| Mixed waste | thousand tonnes | 17.6 | 14.6 | 11.5 | |
| Others | thousand tonnes | 60.7 | 42.6 | 30.4 | |
| < Domestic non-consolidated > | |
| Priority items and remarks | |
|---|---|
|
Civil engineering construction division |
Number of priority items: 40 items |
|
Building construction division Construction sector |
Number of priority items: 43 items |
| Design sector | Number of priority items: 21 items |
| Office operation sector (office supplies) | Office supplies compliant with the Act on Promoting Green Procurement and Eco Mark products |
| Office operation sector (OA equipment) | Copiers, computers, printers, facsimiles, displays |
| < Domestic non-consolidated > | ||||
| unit | FY2022 | FY2023 | FY2024 | |
|---|---|---|---|---|
| Blast furnace ready-mixed concrete | thousand tonnes | 200.4 | 104.7 | 159.1 |
| Electric arc furnace rebar | thousand tonnes | 70.0 | 88.7 | 60.5 |
| Electric arc furnace steel | thousand tonnes | 17.0 | 12.4 | 8.7 |
| Blast furnace cement | thousand tonnes | 2.4 | 3.1 | 0.0 |
| Recycled crushed stone | thousand tonnes | 72.8 | 59.9 | 83.1 |
| Asphalt mixture | thousand tonnes | 9.3 | 10.5 | 17.5 |
| < Domestic non-consolidated > | ||||
| unit | FY2022 | FY2023 | FY2024 | |
|---|---|---|---|---|
| Total | thousand m3 | 372.9 | 451.7 | 206.5 |
| Construction sites | thousand m3 | 359.2 | 436.4 | 191.9 |
| Offices | thousand m3 | 13.7 | 15.3 | 14.6 |
- * Water consumption was calculated from water usage charges.
| < Domestic non-consolidated > | ||||
| unit | FY2022 | FY2023 | FY2024 | |
|---|---|---|---|---|
| Asbestos-containing waste | t | 59.1 | 68.6 | 1,954.9 |
| Waste asbestos | t | 214.3 | 158.1 | 42.1 |
| Mercury usage (fluorescent light) | t | 37.1 | 21.6 | 27.0 |
| Waste oil | t | 18.4 | 26.5 | 77.6 |
| Hazardous sludge (Pb): lead | t | 141.6 | 192.8 | 372.3 |
| Disposal of other hazardous substances | t | 17.2 | 201.7 | 319.3 |
4. Contribution to a Society in Harmony with Nature
We are implementing activities to protect rare plants and animals and to preserve biodiversity at our construction worksites. In FY2024, we conducted protecting activities at seven sites in the civil engineering construction worksites and two in the construction sites.
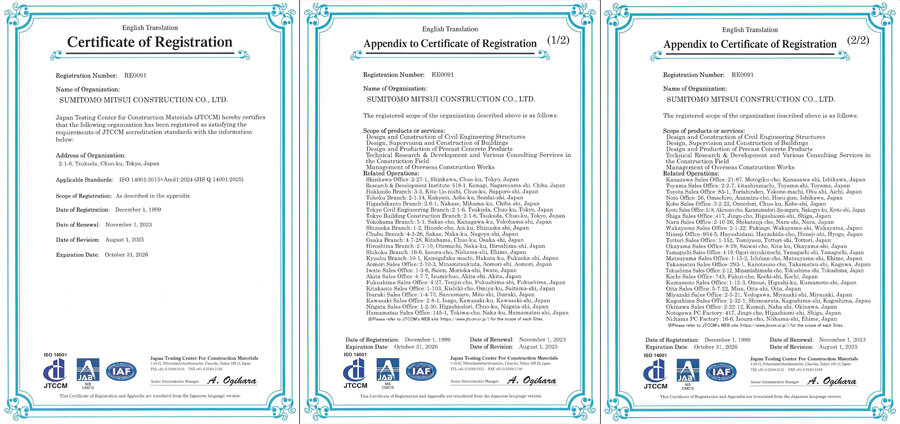
5. Certification of Environmental Management System
6. Independent Assurance Report